Pages

Thursday, June 5, 2014

BQ #7: Origin of the Difference Quotient

What is the difference quotient?
The difference quotient is the formula in order to deduce the slope of a line that touches a curve on the graph. It allows us to be able to find any slope of any line at any point. It essentially is very similar to the slope formula where the main formula is the change of y divided by the change of x. The main difference here is that the difference quotient, we label the change in y as f(x) while in the slope formula, we see that we instead use the change of y as the y-axis.

Slope Formula
Slope Formula
In order to understand the difference quotient, we must explain how it relates to the slope formula. If we use what we learned earlier, we would change this equation to the change of y over the change of x. The issue with this equation is that it is only applicable to straight, non-curved lines. In order to find a curved one, we must use another formula, which is where the difference quotient comes into play.

Difference Quotient

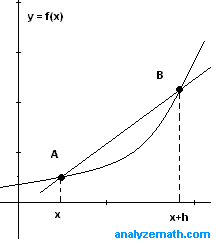
Where this equation comes from is where a line passes through two main points at A and B, which is
 (x, f(x)) as well as (x+h, f(x+h)). This is essentially also called the secant line.
                                                              graphs of function f with secant line
                                                     http://www.analyzemath.com/calculus/Differentiation/difference_quotient.html
Furthermore the change of x is basically h. This is where we get delta x from. To not be mistaken, the difference quotient is not used only for curved lines. In fact, we can also use it for straight lines as well. It is therefore a paramount concept that will most definitely be a boon in calculus. To actually find the slope of a line given this formula, we use the difference quotient in order to find the derivative. We do not directly find the slope from the difference quotient. In fact, it is a multiple step process that involves us to find the derivative. After we do so, we input the value of x into the resulting derivative to get our slope. The tangent line is merely what the secant line is trying to get closer to as we solve for the derivative. We take the limit as a point and another one move closer to one another, which is how we find our tangent line. The difference quotient, all in all, is a method we use to find the slope of any line.

References:
http://www.analyzemath.com/calculus/Differentiation/difference_quotient.html
http://math.about.com/od/allaboutslope/ss/Find-Slope-With-Formula-JW.htm
http://www.tc3.edu/instruct/sbrown/calc/ln021.htm

Monday, May 19, 2014

BQ #6: Unit U: Concepts 1-8: Limits of Functions

What is continuity? What is discontinuity?
         Continuity is a term used to describe a function that you can draw without any breaks or stops, meaning your pencil does not lift from the paper. That means that there are no hole, no breaks, and no vertical asymptotes to halt the function. 
          Discontinuity is where there are those aforementioned terminologies which include point, jump, oscillating, and infinite discontinuities as well as oscillating behavior. These continuities fall under two categories: removable and non-removable discontinuities.
           Removable discontinuities consist of point discontinuities, which are also known as hole discontinuities. An open point is a characteristic of this discontinuity without any point above or below the y-coordinate. a function exists at this point on a function of a graph.
          
http://www.ck12.org/book/CK-12-PreCalculus-Concepts/r508/section/1.10/
        Non-removable discontinuities consist of:
-Jump Discontinuites which are characteristic of two points, 1 closed 1 open or two open, on top and bottom of one another and part of different functions. The reason why this is a discontinuity is because to construct the whole graph, one would need to life his or her pencil off the paper to continue drawing the graph. There is a jump in the graph.
Graph of piecewise function
http://www.sagemath.org/calctut/inflimits.html
-Oscillating Behavior is when there is a wiggly function on the graph. There is little to explain other than this picture below.
http://www.sagemath.org/calctut/inflimits.html
-Infinite Discontinuity is where there is a vertical asymptote that caused the graph to go to infinity and beyond...upwards and downwards. There is unbounded behavior when this occurs as the graph can reach indefinitely infinity where it increases or decreases without any bounds at all.

What is a limit?
A limit is basically the intended height of a function. We have a specific equation for this with lim f(x)=L with x->#. This equation is equivalent to saying the limit as x approaches a # of f(x) is equal to L. We never reach the limit because there are an infinite amount of values that we can write before we can actually reach the limit. An example would be reaching 2. From the left we would list values of 1.9, 1.99, 1.99, and etc., but we can never actually reach 2 because for all we know we can write 1.99999999999999999999999999999999999999999999999999999999999999999999999999999999999999999999999999999999999999999999999999999999999999999999999999999999999999999999999999999999999999999999999999999999999999999999999999999999999999999999999999.
 By using a limit, we don't get the perfect answer. However, we want to fix and upgrade the values we want to make it close to being the perfect answer. The limit is very similar to what we want to find which is the instant change rate on the graph. 

How do we evaluate limits numerically, graphically, and algebraically?
             In order to evaluate limits numerically, a table must be drawn. There are 3 values of a number that should be listed to the left and right of the designated number, respectively. The ideal difference that should be shared between the middle # and the most left and most right numbers should be a tenth, 0.1.  The trick here is dealing with negative numbers. If we take -2, for example, the left number should not be -1.9, because that although that would be true for a positive 2, the left side must have a number that is lower than the designated value. -2.1 would therefore be the correct answer for the left of -2. Afterwards, you basically add a digit to the decimal place and get -2.01 in order to begin getting closer to the limit. The point here is that you do even though we do not get to the limit, we get closer and closer to it.
            To evaluate a limit graphically, we would draw the graph by inputting the function into the table.We would then place the point of our pencil on the graph at a position where the point is to the right of where x=a. We would then move the point along the graph to x=a from the right of the graph. Whatever value the y-coordinate approaches should be where our limit is. We do the same thing except from the left of x=a.
            Evaluating a limit algebraically we can use three methods:
-Direct substitution. Sometimes merely inputting the value of the limit can yield results we want. If we get a an answer that is not 0/0, which means indeterminate form, then we are done. However, when 0/0 is the case, we need to utilize other methods.
-Factoring. We can factor out the numerator and denominator the best we can and when we get a more simplified equation, we can then plug in the value of the limit to find our answer.
-Conjugating. We can multiply the top and bottom by the conjugate to find the limit. By multiplying the numerator and denominator, we are attempting to do the same thing as factoring. We are trying to cancel anything from the equation in order to further simplify it to then use substitution to get our answer.


http://www.ck12.org/book/CK-12-PreCalculus-Concepts/r508/section/1.10/
http://www.sagemath.org/calctut/inflimits.html
http://idiotsguides.com/static/quickguides/math/calculus-101-what-is-a-limit.html
http://people.hofstra.edu/stefan_waner/realworld/tutorials/frames2_6b.html
http://www.mathsisfun.com/calculus/limits-evaluating.html

Tuesday, April 22, 2014

BQ #4: Unit T- Concept 3

Why is a normal tangent graph uphill, but a normal cotangent graph downhill? Use unit circle ratios to explain.
Tangent: The reason why a normal tangent graph is uphill is because of its unit circle ratio of y/x. Because y/x is the equivalent to sin/cos, we see that whenever cos, or x, equals 0, there will be a vertical asymptote at that point. In this case, a tangent graph has asymptotes at π and 3π/2. Also, tangent is positive in quadrant 1 and 3 while being negative in 2 and 4. We can label the quadrants by every π mark starting at π/2, and label -π/2 as quadrant 4. Since we know in which quadrant tangent is positive, we draw the line ascending from the negative quadrant into the positive quadrant.

Cotangent: The cotangent graph is downhill due to its ratio of x/y. In this case, there is a vertical asymptote whenever sine equals 0. This occurs at π and 2π. The quadrants in which it is negative and positive is relatively the same as tangent. However, the location of the asymptotes starts at π and continues for every subsequent period of π. That means that we have an asymptote starting at the 0 mark and the π mark while it continues infinitely. We label every π/2 interval as a quadrant, and therefore we see that in quadrant 1 the graph descends downward to quadrant 2 where it is positive, constituting its downhill direction.

Saturday, April 19, 2014

BQ #3- Unit T Concepts 1-3

How do the graphs of sine and cosine relate to each of the others? Emphasize asymptotes in your response.

Tangent?
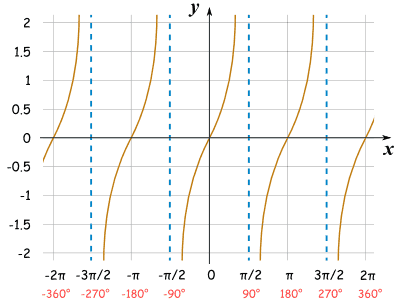
The graphs of sine and cosine relate to tangent in contrasting and comparing ways. They all begin positive in the first quadrant. However, in sine and cosine, they are π/2 apart in the intervals that they cross the x-axis, and the distance they are apart when on the same graph. The tangent graph,however, at the π intervals, is undefined due to the prevalence of asymptotes when x=0 and due to that value along that asymptote possibly being infinitely positive or infinitely negative. We see the tangent graph that, instead of the line going horizontally infinitely, goes vertically infinite with a range of (-∞,∞).
                                   http://www.mathsisfun.com/algebra/trig-sin-cos-tan-graphs.html
Cotangent?
In the case of cotangent, its graph goes downhill. Therefore, in comparison with the graphs of sine and cosine, whose graphs start out positive, cotangent beings at a negative angle. This assumes that all graphs start at a value of a=0. Cotangent, being an inverse of tangent, of course will still have asymptotes. The asymptotes are still the same distance as they were for a cotangent graph, π. The difference with tangent is that cotangent has asymptotes where y=0, or where sin equals 0.

                            http://www.regentsprep.org/Regents/math/algtrig/ATT7/othergraphs.htm
Secant?
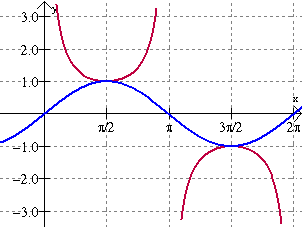
To graph a secant graph, just do the same thing you do with the cosine graph. The difference here is that the secant graph has parabolas drawn at the mountains and valleys of the shifted parent graph. Also, secant graphs have asymptotes at π/2 with a period of π, meaning that they repeat their asymptotes every π distance. due to their asymptotes, the parabolas can not pass them and thus go continuously upward or downward, as described in the picture below. Unlike sine and cosine graphs, a secant graph, just like tangent, cotangent, etc. does not have an amplitude because the graph goes continuously downwards or upwards, as aforementioned.

                               http://www.regentsprep.org/Regents/math/algtrig/ATT7/othergraphs.htm

Cosecant?
Cosecant graphs are just like sine graphs, but like secant, has vertical asymptotes and parabolas after we graph the parent graph and its shifts. We draw the parabolas at the mountains and valleys of the graph just like the secant graph. The difference between cosecant and secant is that in one period, a cosecant graph has two parabolas instead of secant which has 1 parabola going downwards and 2 half-parabolas going upwards. I say that they are half-parabolas because the asymptote within one period limits it. If we were to graph more asymptotes the parabola would of course be whole. The cosecant graph has asymptotes have asymptotes which occur at π every π unit, as shown in the below video.
http://www.regentsprep.org/Regents/math/algtrig/ATT7/othergraphs.htm

References:
http://www.regentsprep.org/Regents/math/algtrig/ATT7/othergraphs.htm
http://www.mathsisfun.com/algebra/trig-sin-cos-tan-graphs.html

Friday, April 18, 2014

BQ #5-Unit T Concepts 1-3

Why do sine and cosine not have asymptotes, but the other four trig functions do? Use unit circle to explain.
Sine and cosine do not have asymptotes due to their ratios on the unit circle. To have asymptotes, you must have an undefined value. Therefore, to obtain an undefined value, a denominator of 0 must be held because you can not divide a number by 0 and not have it be undefined. Sine's ratio is y/r, while cosine'sis x/r. r can not equal 0 because on the unit circle it always equals 1. Therefore, sine and cosine can not have asymptotes. Csc and sec can have asymptotes because their ratios are inverse of sine and cosine. Their rarios are r/y and r/x. In this case, x and y can equal zero, representative of the points (0,1) and (1,0), if y and x can equal zero, and they are the denominators of the ratio, then those values would be undefined, thus constituting the prevalence of asymptotes. It is the same thing with cotangent and tangent. Their respective ratios are x/y and y/x. Since y and x can equal zero on the unit circle and are the denominators of the ratios, then there is a possibility for them to have asymptotes when graphed. An asymptote is, for these trig fuctions, a vertical dashed line that can not be passed on the graph because the graph can not have a value that sits on an undefined line. As a result, we have the other four trig functions besides sine and cosine to have parabolas because the lines we draw must approach the asymptotes but not pass them, while in sine and cosine that is not the case.

Wednesday, April 16, 2014

BQ#2- Unit T Intro

How do the trig graphs relate to the Unit Circle?
The graphs connect with the Unit Circle as when the curves approach a certain value, they are representative of the quadrant the value is in. For example, when the curve is between 0π and π/2, the curve is positive for all graphs because in quadrant 1, all trig functions are positive. the curve's y-value would therefore be above 0. For sine, the curve becomes negative after it reaches π because at that point sine is negative and thus the graph begins to curve downward below the y-value of 0.

Period?- Why is the period for sine and cosine 2π, whereas the period for tangent and cotangent is π?
The period for sine and cosine is 2π because it takes the entire rotation of the unit circle to alternate between a positive and negative value. sine beings positive in two quadrants as positive, then the next two as negative until it returns to the first quadrant as a positive once again. For cosine, the unit circle begins positive, with it passing two quadrants that are negative, then returns to being positive in the fourth quadrant. Graphically, the line shifts downward when its shift value corresponds to the appropriate unit circle quadrant. Tan only needs 1 π as its period because its shift to a negative from a positive only takes two quadrants instead of four. Tan is positive in the first quadrant but negative in the second.

Amplitude?- How does the fact that sine and cosine have amplitudes of one (and the other trig functions don't have amplitudes) relate to what we know about the Unit Circle?
Amplitude is present in sine and cos because there is a restriction for sine and cosine, who can't be used for values of less than -1 and greater than 1. Other trig functions can, however. The reason why sine and cosine are restricted is that the unit circle has values that would not make sense if the value was less than or greater than 1. For sine, y/h, you can not make the opposite side bigger than the hypotenuse because it defies the whole concept of right triangles. It is a common understanding that the hypotenuse is always the largest side. When it is not, as when the value of y is 1, then of course we have a quadrant angle as an answer because if y is 1, then x must be 0, which would mean that the ordered pair would be (0,1), or 90*. It is similar for cosine as if cosine is bigger than 1, then the value of x/h would be greater than 1, an impossibility. If x is 1, then y must be 0, which has an ordered pair of (0,1), which can be either 0* or 360*.

Thursday, April 3, 2014

Reflection #1: Unit Q: Verifying Trig Identities

1. What does it mean to verify an identity?
            When we verify an identity, it means that we are trying to solve the equation in such a way that when we solve for the left side of the equation, it will, in the end, equal to the right side. Verification is necessary to prove an identity to be valid. When we first solve one of these identities, we want to ignore the right side. The right side is the answer we are trying to get. We use a multitude of techniques to change the left side of the equation as to get it to the right side. We can use reciprocals, we can change the identities to another one, or we can factor out trigonometric functions. We can also, in the process, cancel anything that can be canceled out. All of these strategies are to reduce the left equation as to match the right side- the verified answer. When both sides match, then we have verified our identity.

2. What tips and tricks have you found helpful?
            Tips I have found helpful is methods of solving an identity equation. If you are stuck on finding the next step in an identity, I like to see my options: can I use reciprocals? Can I use factorization? Can something be canceled out? Did I properly changed my identities? Did I try to convert everything to sin and cos? I like to use these rules to guide my problem-solving . All in all, I like to use try to have at most two trig functions when I am solving and will try to get it that way through identities. A strong tip I have is to know your identities inside-out. It is apparent that you should know your identities to solve identities. Even though you may be able to use your SSS packet to see the identities, it is much better to know them from the top of your head in order to conserve time and because if you know the identities from your memory, you will be able to think of many different paths to solve an identity, thus becoming an expert at identities.

3. Explain your thought process and steps in verifying a trig identity, in general terms.
           I believe this question has been answered as I have explained it in my tips and in my answer in what it means to verify an identity. To clarify, I like to have many options at hand in solving trig identities. If the trig identity is straightforward, then of course I will take the quickest path to solving. However, when the identity consists of fractions and tan, cot, sec, etc., I prefer to conjure ways to solve them in the most simple way, through a variety of methods, as mentioned before. I find it best when I convert the original trig function to sin and cos. I then look for any times I can multiply the numerator by the reciprocal of the denominator so I can look to square trig functions. I find it more preferable to look for ways to square them because then I open the range of identities at my disposal. If that is not possible, I see if I can solve the equation by factorization. This is best done in fraction equations, as things usually cancel out. Overall, depending on the type of trig identity I have to solve, I like to use the corresponding, most efficient method to solve it. I just find factorization and reciprocal multiplication to be the two techniques I have used the most during the problems in this unit. So basically, I look at the type of problem I am doing, and I use the appropriate process, such as factorization, reciprocals, and changing identities.